- (0)
- 4
Aug -
Author : Stocks_Reporter Category : ThinkOrSwim, ThinkOrSwim Studies
Tags :
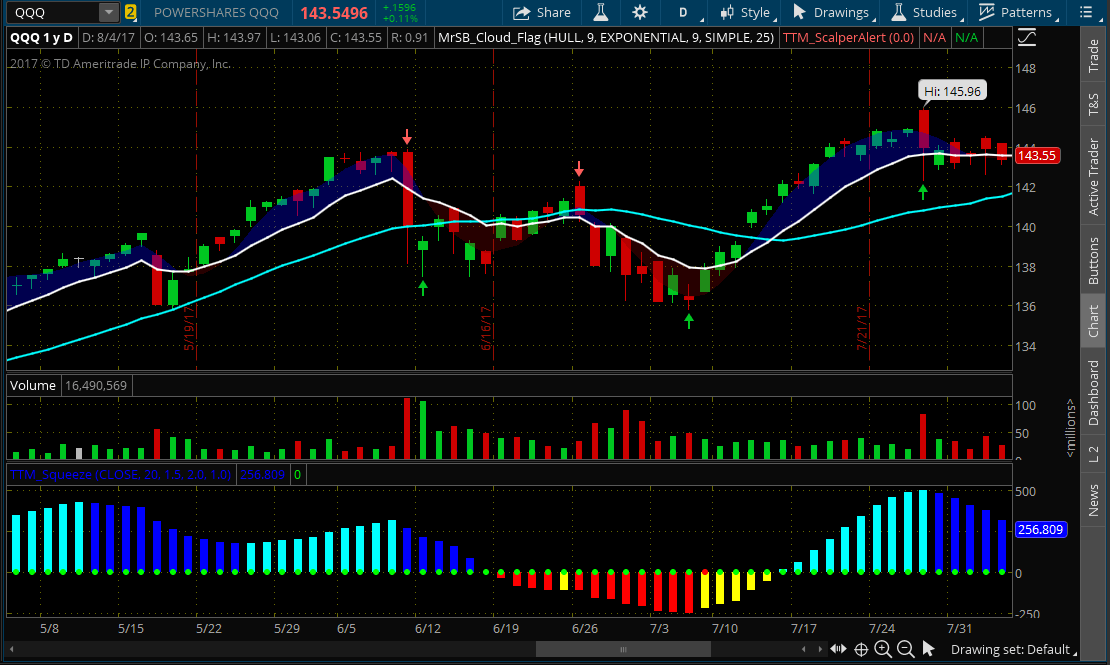
The DMO Triforce study set is a ThinkOrSwim study set of custom indicator that can be selected to display on a chart for long term trades. At the bottom of this post is a link to download this study set and a link to instructions on how to install it. This set of indicators can be used to assess the overall strength or weakness of a stock or index. This can be used to monitor a position you are already in, or to pick an entry or exit point.
How to use these indicators:
This is a study for longer term trades. It works best on longer time frame charts. The best chart time frame for this indicator is a 1 year chart where each candle is 1 day. The minimum time frame I would use with this study is a 4 hour chart (each candle represents four hours).
- Green up arrow on charts is a pivot point (upward trend). stock may continue to rise from here
- Red arrow down on chart is a pivot point (downward trend). Stock may continue to fall from here.
- White line/blue line cross over on chart. white line crosses above blue line (bullish). White line crosses below blue line (bearish)
- In squeeze panel: Red dots mean consolidation (don’t open a trade yet). Green dots means momentum shift (price has moved outside the Bollinger bands). The first green dot after a series of red dots, together with the first light blue bar, may be an indicator to open a LONG trade. The first green dot after a series of red dots, together with the red bar, may be an indicator to open a SHORT trade.
- In squeeze panel: Light blue bars means upward momentum is building, dark blue bars means the momentum is starting to slow and may be starting to move the other way. 2-3 dark blue bars in a row may be an indicator to take profit on a LONG trade.
- In squeeze panel: Red bars means downward momentum is building, yellow bars means the downward momentum is easing up and it may bounce. 2-3 yellow bars in a row may be an indicator to take profit on a SHORT trade
These indicators, like all indicators, are based on previous price action/volume data. So obviously, they can not accurately predict future price action. But, you can use a combination of all three of these indicators to confirm the direction of the trend.
DOWNLOAD DMO TRIFORCE STUDY SET
Or just copy and paste this link into your ThinkOrSwim application:
http://tos.mx/pafzoS
Go to setup>open shared item>paste link into box.
Detailed instructions on how to add and save a STUDY SET


